LeBio instrument could measure under the sunlight directly

LeBio instrument could measure under the sunlight directly —– can get the actual sunlight spectrum.
Sunlight through the atmosphere, some part of the spectrum refracted by different angle, and the light intensity will be different too. So the sunlight spectrum and light intensity change by every season and time.
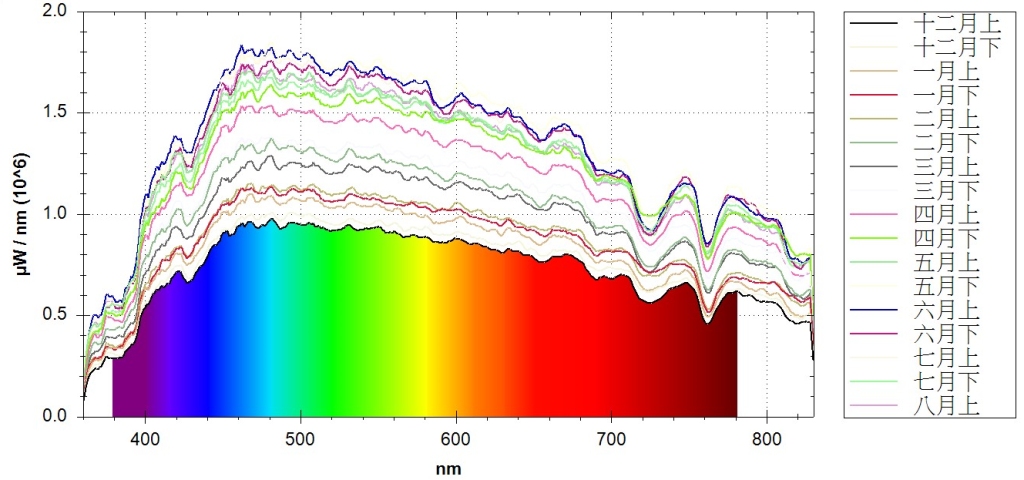
LeBio instrument with our software could check the sun light spectrum and the light intensity which measured every month to make the overlay summarized in together. You can see changes every month for sunlight spectrum and intensity to understand , and analyze the plant growth on different sunlight spectrum and light intensity —— One of the key factors affect to the plant growth is the temperature.
As seen in this figure, the sun intensity in southern of Taiwan (Tainan). December was the weakest, but the production of fruits and vegetables are the most. Overlay indeed can be very easy to see the changes in the sunlight spectrum and the light intensity, and it can cause a lot of new ideas and discoveries
